Posted: November 4, 2016

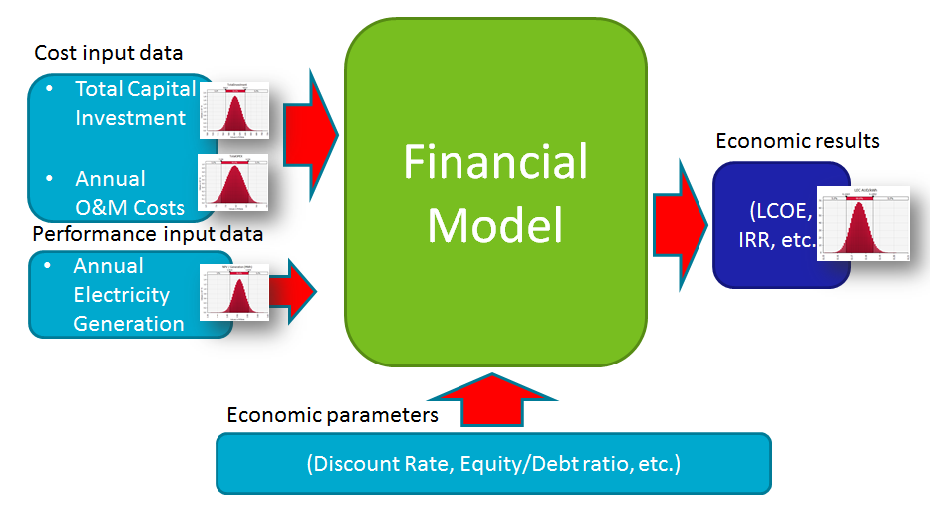
Chart: Manuel Blanco, SolarPaces
Whether investors put their money into large-scale concentrating solar heat and power systems, solar district heating plants or photovoltaic fields, they need to be able to rely on data sets to include the uncertainty and variability of input information. Financial institutions do like to know in what way these factors can impact revenue flows in financing, so researchers of IEA SHC Task 46, Solar Resource Assessment and Forecasting, have spent several years analysing various approaches to the topic. The flow chart of the financing model shows that solar resource data is essential to a proper assessment of the average power or heat generation per year as well as the range of variability over several years. SHC Task 46 is a five-year collaborative effort (2011-2016) with support from the IEA SolarPaces Programme (Task V) and the IEA Photovoltaic Power Systems Programme (Task 14).
Typical meteorological years (TMYs) and reference years (RYs) have been the primary basis for simulating site-related solar resources for decades. They consist of 12 months of meteorological data averaged over a longer period of time – at least ten years. “However, these sets of data lack untypical features; they do not show inter-annual variability and they are not optimised with respect to direct normal irradiance (DNI),” Kristian Pagh Nielsen, Meteorologist at the Danish Meteorological Institute, explained. “Regarding PV and solar district heating plants, both the DNI and the diffuse solar radiation are important. With regard to concentrating solar power and solar heat plants, the DNI is the only important solar resource. The months of a TMY will be different if one considers the DNI only, so the task members have contributed to an IEC committee draft describing how to make TMYs for concentrating solar technologies.”
Simulating complete multi-year data sets
The task members have suggested an improved approach which considers the annually variable yield of a large solar plant. This yield can be described by an annual frequency distribution based on a multi-year set of solar resources. The researchers use the median (P50) value and the P90 value of the annual yield, which are both widely accepted by financial institutions. The median describes a yearly yield curve with half of the probabilities each being above and below a given value. P90 yields, in contrast, correspond to the yearly DNI values exceeded during at least 90 % of the years of a project’s lifetime. Ideally, P90 is to be assessed based on simulations derived from complete meteorological data sets over several years. However, it will often be necessary to provide satellite data on solar irradiance for these sets, as long-term metering of solar irradiance is rare.
Standard considers the lowest common denominator
“Obviously, it always takes time to incorporate the latest research results into industrial standards,” Nielsen said. The upcoming IEC/TC 117 for concentrating solar thermal electric (STE) plants will include a technical specification on how to generate yearly data sets for STE simulations, but this specification does not yet factor in statistical distributions, uncertainty or variability. The IEC 117 Technical Specification can be considered as a lowest common denominator for what should be accounted for when estimating the future annual electricity production; for detailed feasibility studies and profitability assessments the multi-year approach briefly outlined above and expert consultancy is recommended.
In addition to multi-year simulations, there are further improvements being made to optimise the use of meteorological data sets in performance simulations: Researchers must still account for sampling uncertainty and could do the same for the risk of globally affecting volcanic eruptions; another important step will be to incorporate auxiliary meteorological data, such as wind speed and low-level aerosol extinction. Many of these suggestions are at an early stage somewhere during research or development, but will be discussed comprehensively in the upcoming SolarPaces report, Discussion of Currently Used Practices in the Creation of Meteorological Data Sets for CSP Performance Simulations, which is planned to be published in December 2016. The methods described therein will also feature realistic stochastic data sets of high temporal resolution for an economic analysis just like the one illustrated in the chart.
Websites of programmes and institutions mentioned in this article: