Posted: January 22, 2016

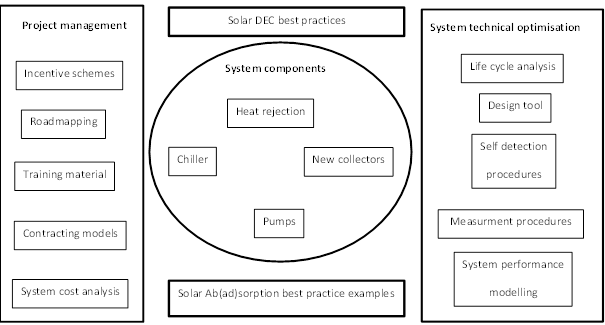
The best solar research results are of little use if they are not distributed and known to stakeholders from the industry, planning departments or public authorities involved in the related field work. This becomes an even more important point if the aim of the research is to “assist with the developing of a strong and sustainable market”. One example: Task 48 (Quality Assurance & Support Measures for Solar Cooling Systems) under the auspices of the IEA Solar Heating and Cooling programme. Between October 2011 and March 2015, a very dynamic group of 30 solar cooling experts teamed up to work on a wide range of topics. As many as 180 person months of research were at the disposal of the programme’s coordinators, which created a lot of interesting output. The cooling specialists accepted and met the challenge by presenting results in a clear structure on the above-shown diagram. The so-called Task 48 Results Diagram could serve as a best-practice model for other international research projects.
Source: task48.iea-shc.org
“Our biggest challenge was to find a bridge between research going on worldwide and the target industry players and markets of solar cooling,” said Daniel Mugnier, Head of R&D department at French Company Tecsol and Operating Agent of Task 48. “So, we developed the Results Diagram to direct the interested audience straight to the content most relevant to them.”
Task 48 results have been grouped into three categories: Deliverables relevant to project management (left), technical reports related to system components (middle) and publications supporting the systems optimisation (right). Each keyword below these categories links to a document, a study, a best practice-brochure or an Excel tool for system design.
The Results Diagram is available on the welcome page of Task 48, which is a subpage of iea-shc.org. Usually, results of IEA SHC Tasks had simply been listed on the subpage Publications in order of their publication date. The Results Diagram does away with the need for having to scroll down a long list to find what you were looking for, for example, the study called Review of relevant international standards rating and incentive schemes, which had already been published in September 2013. The relevant link is part of the project management section on the top – hence, easy to find.
Here’s a few more highlights of the Task 48 diagram; the bold headlines correspond to the links in the Results Diagram:
Design tool: Computer-based pre-sizing tool Pistache for cooling, heating and domestic hot water production was developed by French experts and has been downloaded more than 1500 times since its publication in 2014.
Solar ab(ad)sorption best practice examples: A total of 12 solar cooling projects and their monitoring data have been both summed up and described in detail in the best-practice brochure from June 2015.
Roadmapping: Guidelines for drafting a roadmap on solar cooling. They were published in November 2015 and include recommendations based on the analyses of selected available solar heating and cooling roadmaps.
Training material: The Task partners prepared eight sets of slides for a one-day, tri-partite training course consisting of an overview of the state-of-the-art of solar cooling technology and markets, engineering aspects for system configuration and design, as well as a part on performance figures and economic aspects.
In addition to the Results Diagram, the Task`s website also includes a list of regular participating institutions as well as a list of all Task meetings, the latter with presentations by experts available for download.
More information:
http://task48.iea-shc.org/
Task 48 operating agent (Daniel Mugnier): daniel.mugnier@tecsol.fr